This service is meant for Intraday traders or Swing Traders who would like to Buy Today and Sell Tomorrow (BTST) and vice versa. BTST prediction chart is a single chart with 60mts Time Interval Scale for 5 trading days. Market Trend will be known in advance and if there is potential intraday opportunity to Buy or Sell on any given day, the trade can be executed and carry forward the trade for a day or two in the predicted direction thus capitalizing on the market gaps.
Those who are subscribing for End of Day prediction charts can also use BTST charts in order to nail the right entry to minimize the stop loss risk and carry forward the position till the next turning point predicted in BTST/STBT Chart or Daily Interval Chart.
Suggestion: If traders take intraday entry using 15mts Interval can carry forward the position for the next trading day if the predicted trend is continuing for the next trading day. It helps traders to profit from the gaps. Due to 24 hrs of trading in a day, subscribers are requested to place orders on every Friday to get the next Swing Prediction Map from following Monday to Friday.
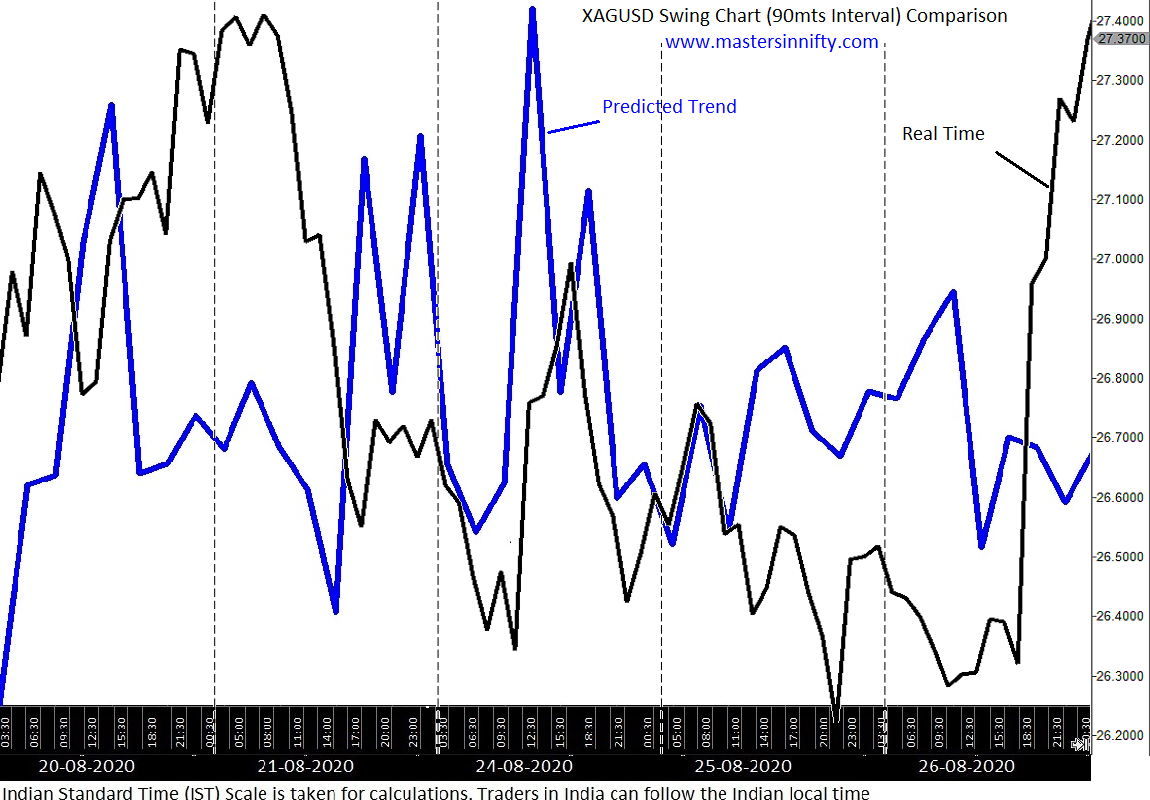
Below are the comparisons charts with Real Time Swing Market Movements. Our predicted line is in Blue and Black is the Real Time Chart.