X

World's No.1 Stock Market Advance Prediction Platform
Call: +91 8971915459 (WhatsApp)
E-Mail: mastersinnifty@gmail.com
World's No.1 Stock Market Advance Prediction Platform
Call: +91 8971915459 (WhatsApp)
E-Mail: mastersinnifty@gmail.com
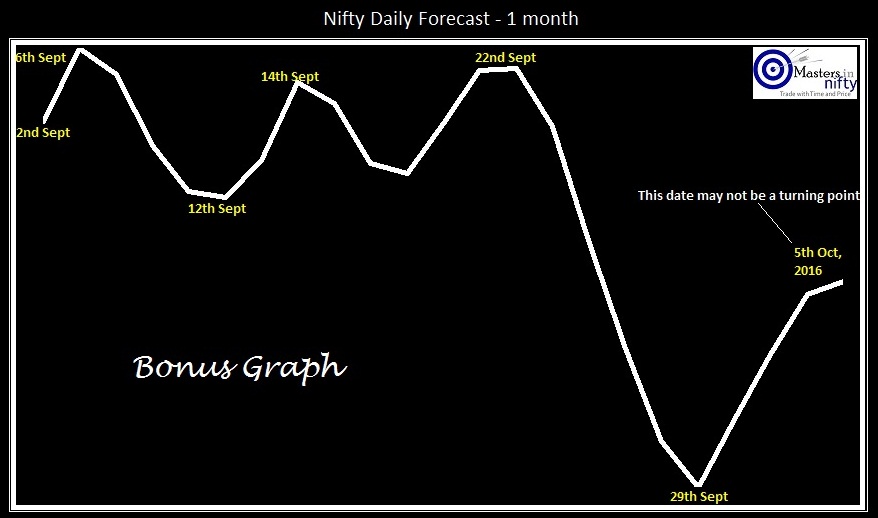
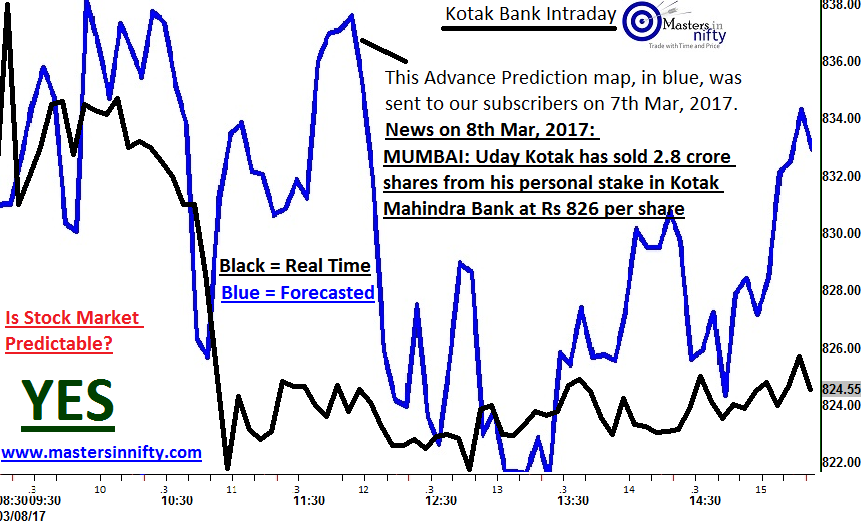
Below is the example of our Nifty intraday forecast chart of 5 minutes interval. The below chart is predicted using Market Time Factor. Sometimes, there is a possibility of inversion of the predicted trend in real-time. Hence it cannot be used as a stand-alone trading solution. The price is not part of the chart since the market movement in real-time is based on TIME. Price follows Time.

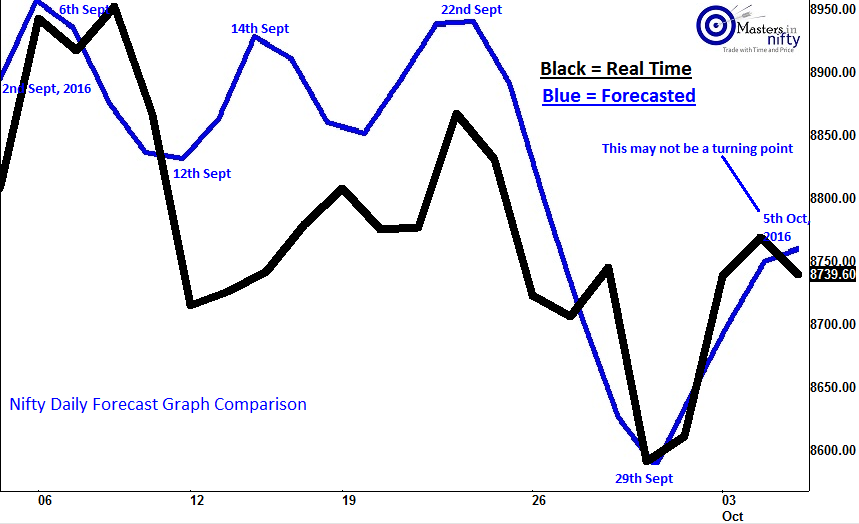
Below is the comparison with the Real-Time Chart after the closure of the market hours.

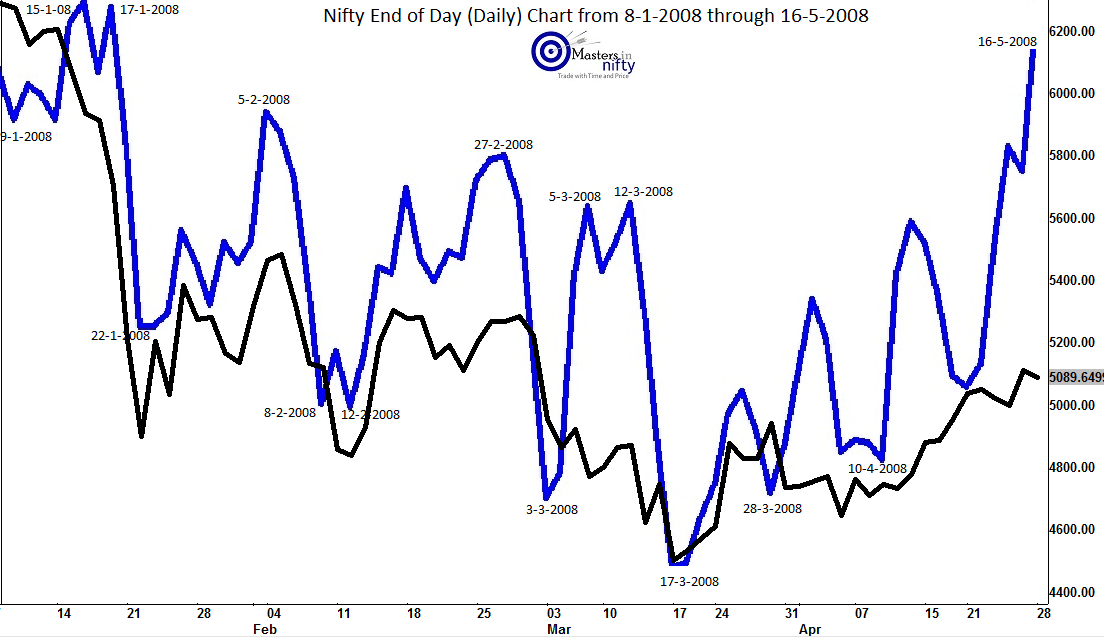
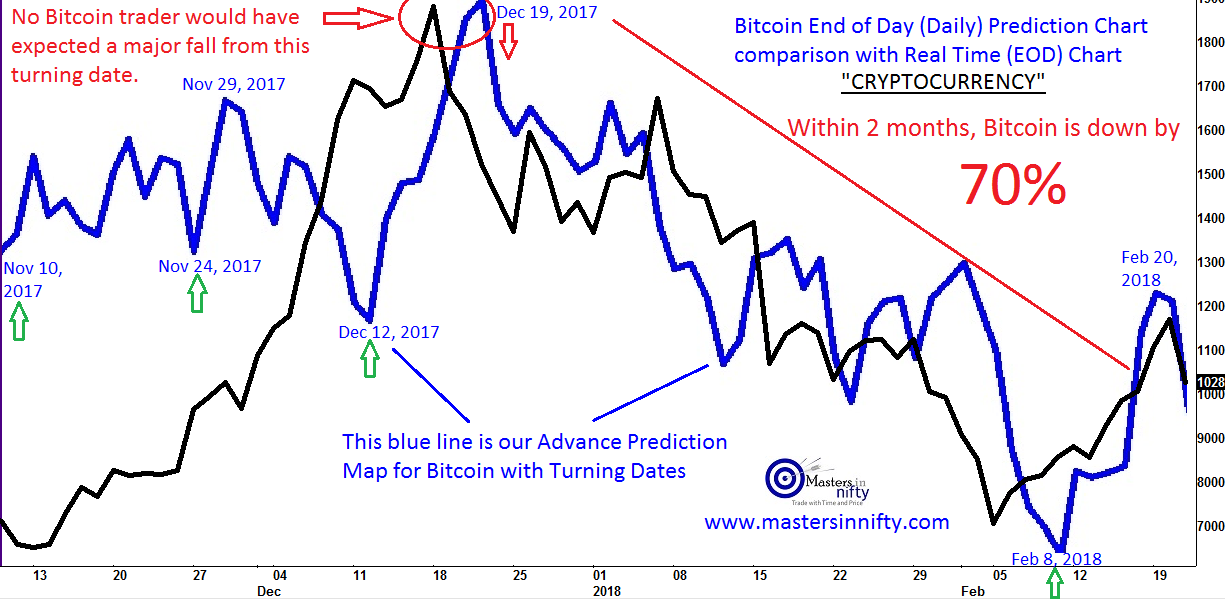
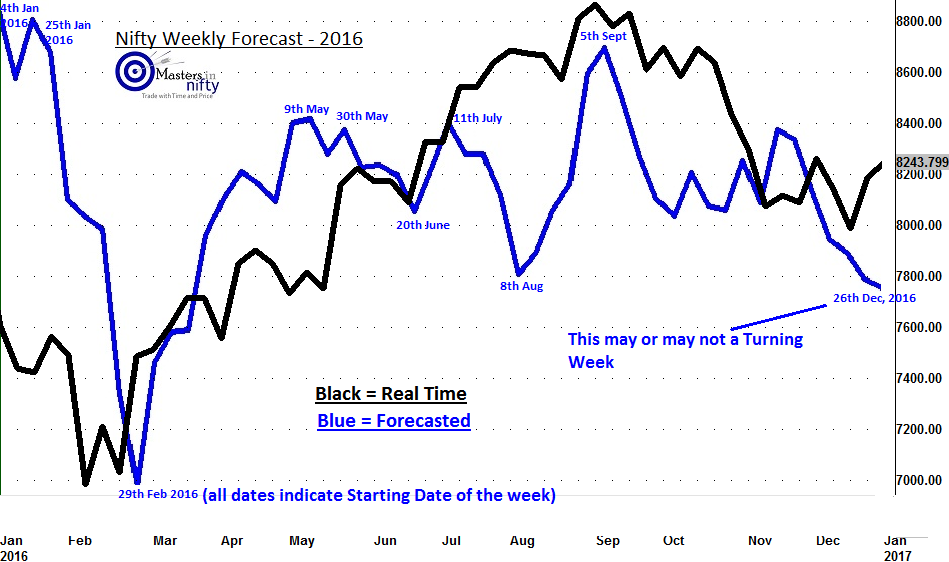
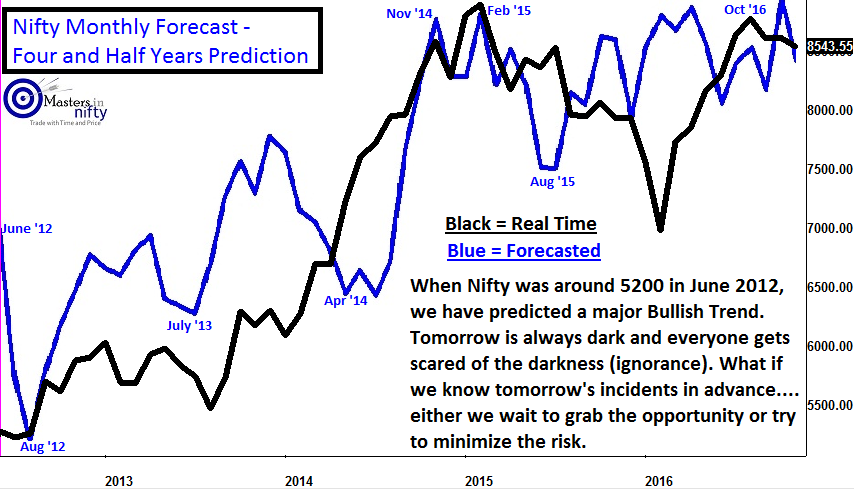
Yes. It can be predicted for any time frame.
All indicators are lagging indicators and no indicator works all the time. There is no holy grail in trading systems or methods. As a trader, one must test the available indicators suitable to risk appetite and choose accordingly. We have no recommendations on the indicators.
If you have your trading account, your broker will give free technical analysis software with many in built indicators.