For subscribers outside India, please email us for "Paypal" link to
Many traders often ask me, "How can you tell what the market will do or what to do when some sudden, unexpected news happens overnight, such as wars breaking out the death of a president, a storm damaging Cotton seriously, the failure of a large trader or brokerage house, or something of that order?" My answer is those coming events cast their shadows before, and the market is nearly always prepared for these events and gives some indication of a change in trend before these events take place - W.D. Gann
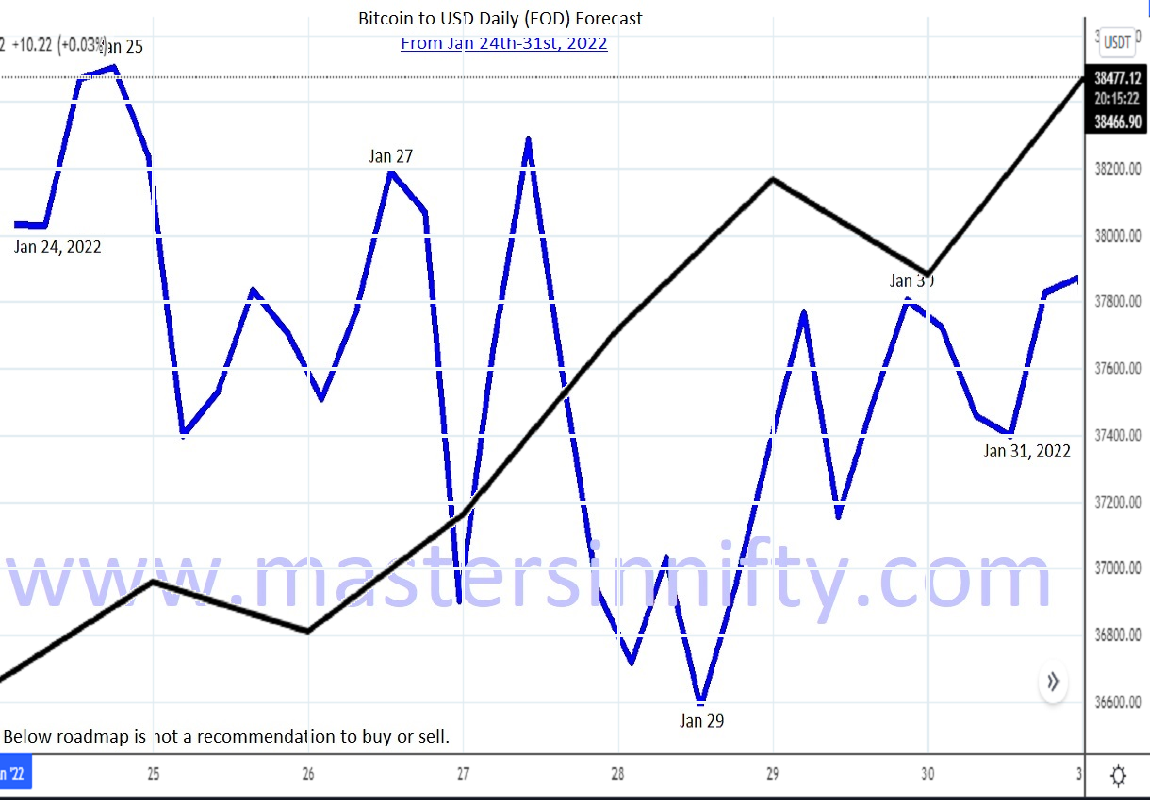
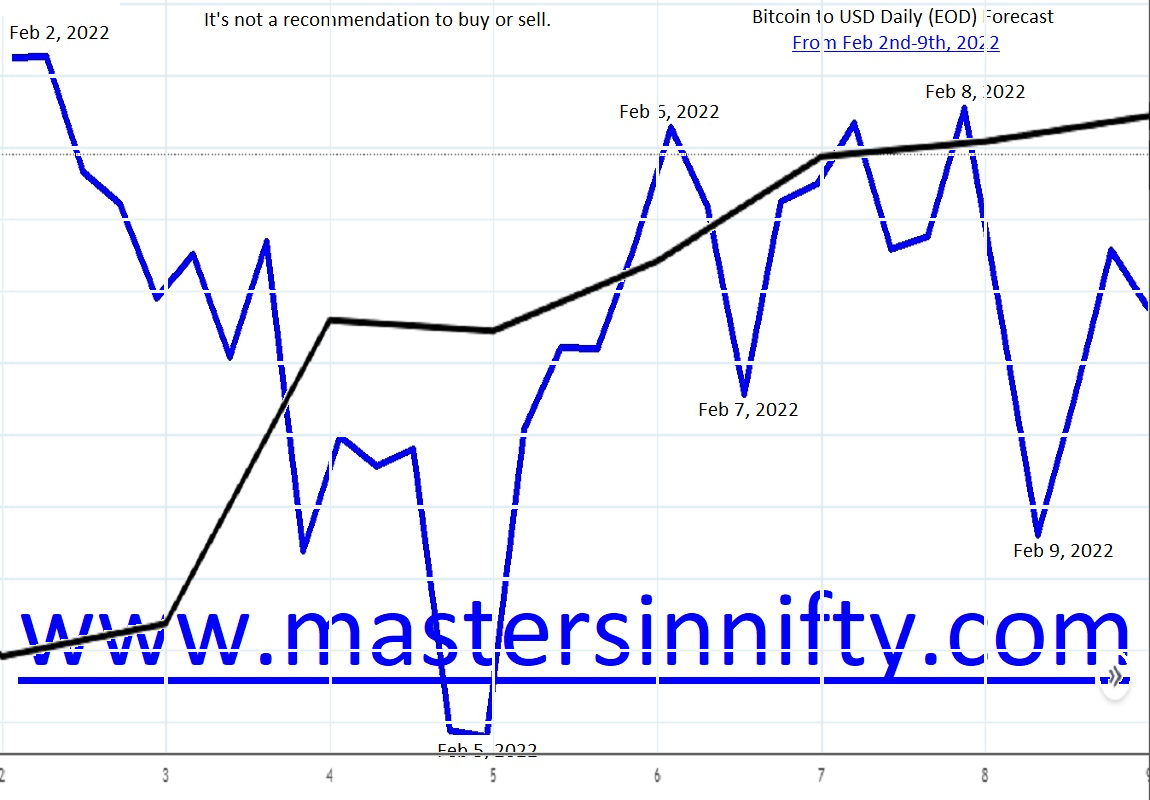
Traders who cannot pay attention to intraday trading can opt for the Daily Prediction service. Daily Prediction Chart or End of Day Prediction Chart is a single chart for a period of 3 months with Key Turning Dates mentioned on the chart.
This service can be used by positional traders either for Cash Market to buy and hold till the next turning date or for Futures trading or Options trading.
Suggestion: If the prediction trend begins in the last week of the month, before expiry, with the next inflection point in the middle of the following month, Futures & Options traders can take positions of the following month.
Below are the comparison charts with Real-Time Daily or End of Day charts. Our predicted line is in Blue and Black is the Real-Time Chart.