Welcome to Gann's Time and Price Analysis, where we introduce a revolutionary approach to market forecasting, combining the renowned techniques of WD Gann with our groundbreaking in-house research. We want to emphasize that while our insights are designed to empower traders, we do not provide explicit buy or sell recommendations, and the accuracy of predicted cycle movements in real-time markets cannot be guaranteed. Trading derivatives involves substantial risk, and it may not be suitable for all individuals due to the potential for unlimited losses.
Our methodology revolves around the three pillars of "Time, Price, and Space." By integrating these elements, we aim to establish a unique rhythm that influences market behavior. The inclusion of "SPACE" is a novel concept in the trading world, enhancing the distinctiveness of our approach beyond traditional analyses.
Understanding key turning points in time and forecasting high-probability price movements is pivotal for achieving low-risk entries and optimizing trading outcomes. Our approach provides a roadmap for precise entry points based on predicted price directions. In the absence of a clear entry signal, traders can rely on indicator confirmations to align their positions with our prognostications.
One remarkable aspect of our methodology is its applicability across various timeframes, enabling predictions ranging from minutes to years in advance. As an illustration, based on our Time and Price calculations, we anticipate that the Nifty Spot should trade below 18288 on Nov 23, 2023, as of our update on Jan 25, 2023. Any deviation from this predicted price may prompt a reassessment of our calculations.
This represents the forefront of technical analysis, leveraging innovative insights to empower traders. We encourage you to explore the real-time examples below to witness the practical application of our methodology. Stay informed, and we look forward to enhancing your confidence in trading through our cutting-edge discoveries.
A few illustrations below:
Updated on February 5, 2023, at 9:28 pm
- The Nifty Futures should trade below 17751 at 11:20 am on the 7th of Feb 2023.
- By March 13, 2023, the Nifty spot should not close below 17542
Look at the examples below (updated on Jan 19, 2023, at 5:30 pm):
- The Nifty spot closing price on Jan 30, 2023, would be below 18119.80 and the Nifty Futures closing price (Feb 2023 contract) would close below 18269.96. To cut it short, the statement indicates that if the market moves higher than the above prices, there would be more selling pressure till Jan 30, 2023, and the above prices would act as the first targets to exit or to tighten the stops to benefit from any further potential move. This is where both Time and price play a role.
- Below is the Nifty Futures Real-Time chart on Jan 30, 2023 (updated on Jan 30, 2023, at 8:54 pm)

New Cycle update on Jan 26, 2023, at 9:53 pm:
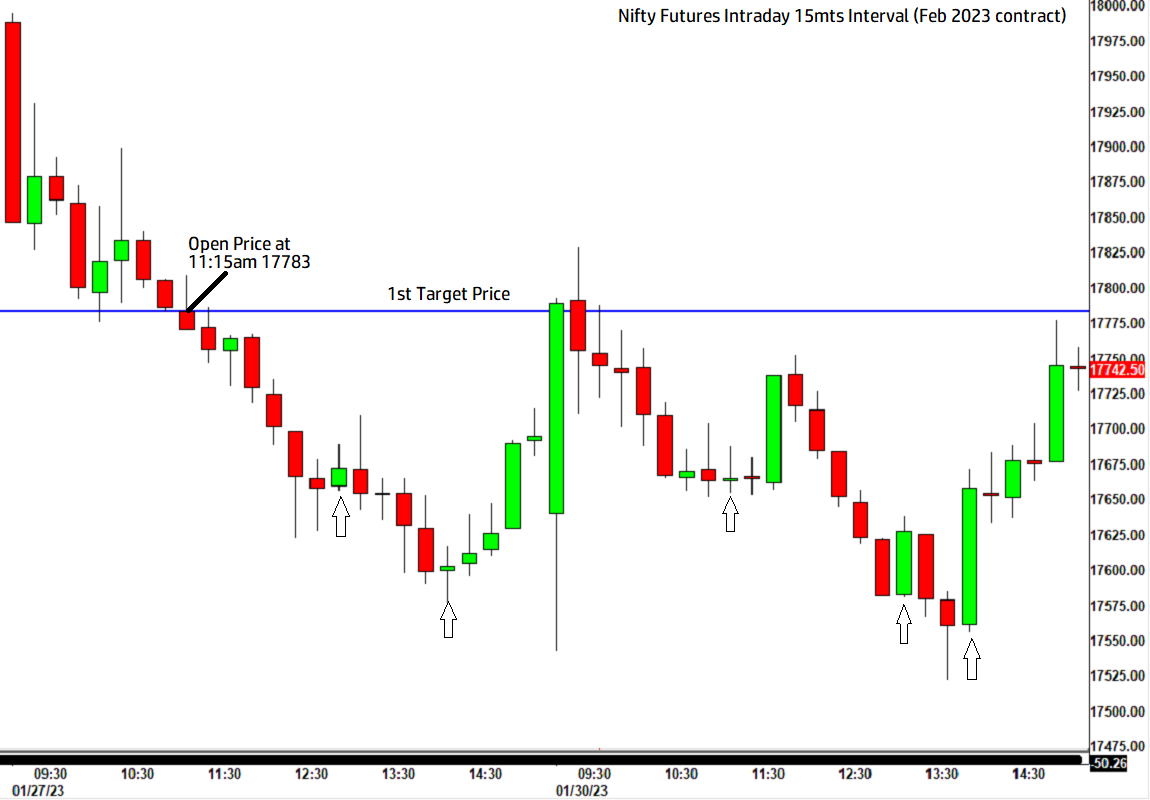
- If Nifty Futures (Feb contract) price trades below 18216.80 at 11:15 on Jan 27th, then expect a Bullish Trend till 14:15 hours on Jan 30, 2023. If closes above 18216.80 at 11:15 on Jan 27th, then expect a bearish trend till 14:15 hours on Jan 30, 2023.
- The below chart is updated on Jan 30, 2023, at 9:11 pm.
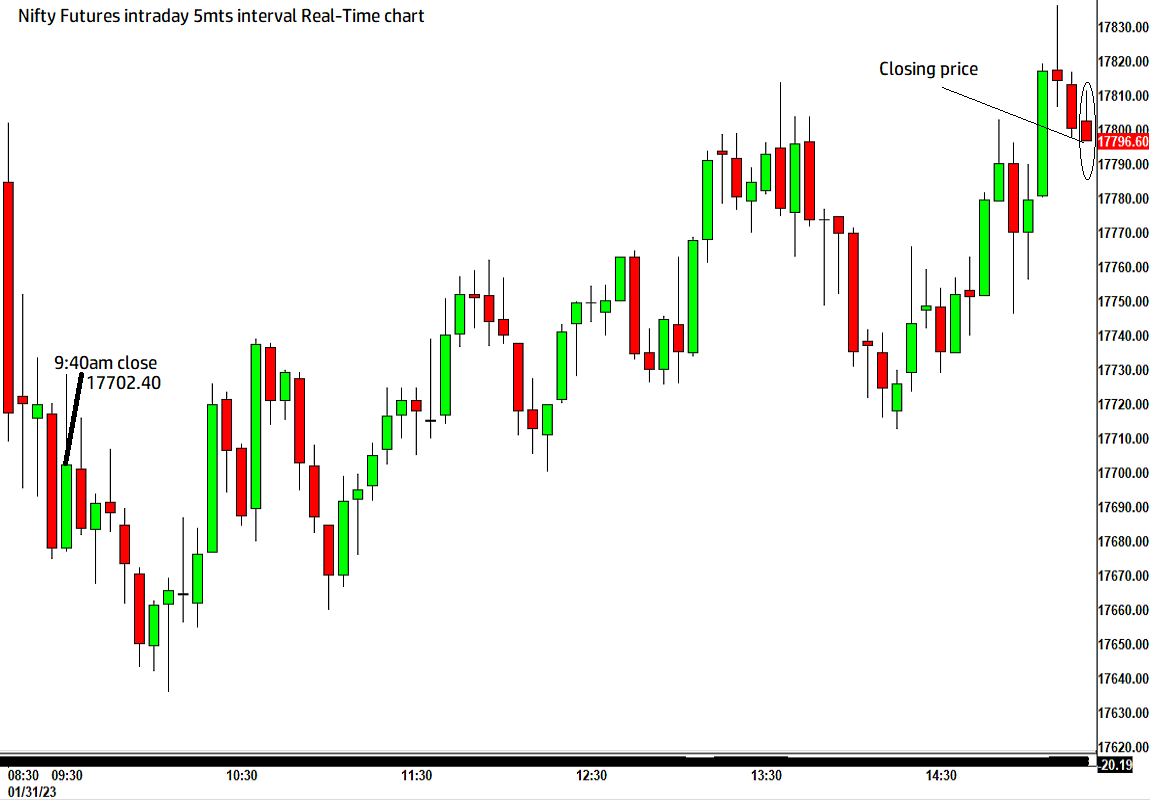
- Update on Jan 30, 2023, at 9:12 pm: The Nifty Futures price at 9:40 am on Jan 31st, 2023 should trade above 17755, and the Nifty Futures closing price on Jan 31, 2023, will not close below 17582.
Below is the Nifty Futures intraday Real-Time chart on Jan 31, 2023 (updated on Jan 31st at 9:21 pm)